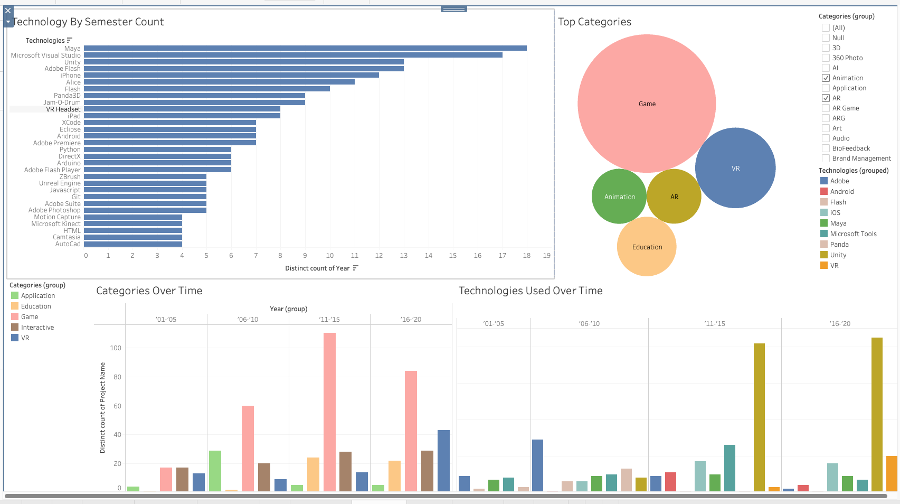
Based on the ETC Data Analysis project, this work explores the visualization of the 10+ million files stored in that projects database of file metadata. Students are working with the Tableau visualization suite to show changes in project structure over time and how the different contents of projects are organized. The hope is to find trends in the longitudinal data set that can help with born digital asset curation and preservation workflows. What are the most popular files over time? What kinds of projects tend to dominate the data set?
The project's main output will be an interactive dashboard that allows users to explore the files in the data set and pose new questions about the collection.